Statistical Graph
Introduction
Student Nurses can use the knowledge of chronic obstructive pulmonary disease obtained from the classroom and apply it during their placements to help ailing patients fight the vice. The statistical graph presented below shows the death rate from COPD by sex and age group, in Canada from 1950 to 2011 (Bryan & Navaneelan)
Deaths per 100,000

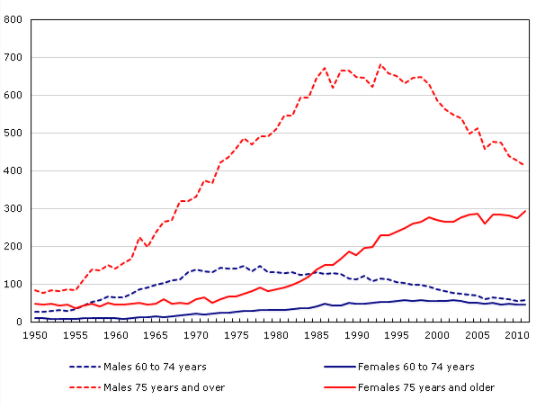
Among the males aged 75 years and over, the mortality rate from COPD was highest from the mid-1980s through late 1990s where it continually declined. For the females in such age group, there was a continual rise in the number of death rates up to the early 200s when it remained constant. From the 1970s through 1980s the difference in death rates between males and females aged 75 and over was high relatively high, and in 2011, the gap remained but it was smaller.
The death rate for males and females aged between 60 and 74 years was small in the 1950s as shown in the graph above. Also, the death rate among males increased more over time compared to that of females, which had a similar trend for those aged 75 years and older. Among males aged between and 74 years, the death rate increased and reached a plateau in the 1970s after which it started to decline. For the females, there was a slow increase in the death rate from the 1950s through early 2000s when the death rate leveled off and started declining from the late 2004. As a result, the gap between males and females in this age group was insignificant. Overall, it can be noted that the death rate from COPD is higher among patients aged 75 years and above, compared to those aged 60 to 74, and higher among males than females in all groups.

1. Bryan, S., & Navaneelan, T. Health at a Glance.
2. Lacasse, Y., Brooks, D., & Goldstein, R. S. (1999). Trends in the epidemiology of COPD in Canada, 1980 to 1995. Chest, 116(2), 306-313.


The download will start shortly.

 Subject:
Health and Social Care
Subject:
Health and Social Care  Number of pages: 3
Subject:
Nursing
Number of pages: 11
Subject:
Health and Social Care
Number of pages: 3
Subject:
Health and Social Care
Number of pages: 5
Subject:
Health and Social Care
Number of pages: 7
Subject:
Medicine
Number of pages: 6
Subject:
Medicine
Number of pages: 2
Subject:
Nursing
Number of pages: 7
Subject:
Health and Social Care
Number of pages: 7
Subject:
Health and Social Care
Number of pages: 2
Subject:
Medicine
Number of pages: 3
Subject:
Nursing
Number of pages: 4
Subject:
Health and Social Care
Number of pages: 10
Subject:
Medicine
Number of pages: 2
Subject:
Nursing
Number of pages: 5
Number of pages: 3
Subject:
Nursing
Number of pages: 11
Subject:
Health and Social Care
Number of pages: 3
Subject:
Health and Social Care
Number of pages: 5
Subject:
Health and Social Care
Number of pages: 7
Subject:
Medicine
Number of pages: 6
Subject:
Medicine
Number of pages: 2
Subject:
Nursing
Number of pages: 7
Subject:
Health and Social Care
Number of pages: 7
Subject:
Health and Social Care
Number of pages: 2
Subject:
Medicine
Number of pages: 3
Subject:
Nursing
Number of pages: 4
Subject:
Health and Social Care
Number of pages: 10
Subject:
Medicine
Number of pages: 2
Subject:
Nursing
Number of pages: 5 